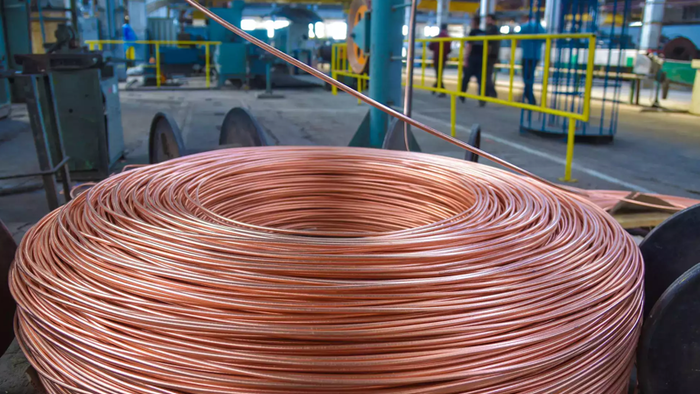
Copper prices volatile amidst declining global growth expectations & trade uncertainty. 3-year charts show $2.5 drop, while 5-year charts show copper price deviation from historical averages, reinforcing a bleak outlook.
0

News, Analysis, Politics, Business, Technology
Copper prices volatile amidst declining global growth expectations & trade uncertainty. 3-year charts show $2.5 drop, while 5-year charts show copper price deviation from historical averages, reinforcing a bleak outlook.